
Choppiness Index
This turbulence index tells you when strong trends are about to start, so you can position yourself at the right moment!
2 min read
The Choppiness Index (CHOP) is also known as the agitation or turbulence indicator. It can be used to determine whether the market is in a consolidation or a trend phase, but above all to know precisely when the strong trend is about to start.
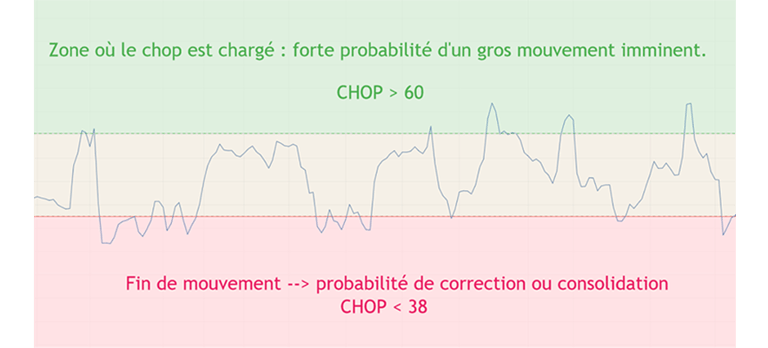
This indicator is limited between 0 and 100, and should be seen as a gauge that charges and discharges. When it's above 60, it's loaded and indicates the likelihood of an imminent explosive movement. When it falls below 38, the trend calms down and the price begins to consolidate. It can also retrace the previous movement slightly by reloading.
However, this indicator does not give the direction of future movement, so you need to pair it with other indicators and integrate it into your trading strategy if you find it effective and relevant.
Like all indicators, the larger the unit of time over which it is observed, the more relevant it will be. In other words, in the medium term, a CHOP loaded in Daily will have more impact than one loaded in 4h. It can also be unloaded in 4h, but loaded in 15min, allowing you to detect a short-term movement that can quickly yield nice percentages.
Here's an analysis of the CHOP Index on the Daily Bitcoin's chart:

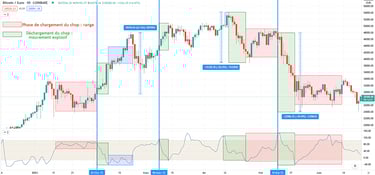
In this example, we can see that the CHOP itself can consolidate at the upper or lower end of its range (1st red zone and blue zone). The Bitcoin price in the 1st red zone is not very volatile, even though the CHOP is loaded, but when it starts to unload (1st green zone), a strong uptrend is initiated.
Turning to the blue zone, we see that the price stabilizes very quickly before continuing its trend while the CHOP consolidates in its lower limit.
When the CHOP charged at the 2nd green zone, it heralded a continuation of the strong uptrend which ended as soon as the indicator touched its lower boundary. The price then retraced a part of its previous upward movement, and the CHOP was reloading.
The 3rd and 4th green zones highlight strong downtrends which began precisely when CHOP was at its most charged and fell violently. And once again, the trends stopped when the lower bound was reached.
Reloading of the CHOP corresponding to the 2nd red zone takes place as the price retraces its bearish movement upwards, and that of the 3rd red zone takes place as the price stabilizes in an almost perfect range.
This indicator therefore seems highly relevant when mastered, although it in no way gives the direction of the trend to come. Coupled with chartist analysis and other indicators, it proves to be an invaluable asset for placing yourself on the market at the right moment for all types of trades, since it works on every unit of time.
©2025
Contact@watchlist360.io
Watchlist360 does not provide any financial advice
⚠️Investing involves risk and may lead to partial or total loss of your capital⚠️