
Bollinger Bands
Guess at a glance whether the market is consolidating or trending, and detect the right moments to take a position.
2 min read
The Bollinger Bands are an indicator that, like the Choppiness Index, can be used to determine market phases. It can also be used on all timeframes and is extremely accurate.
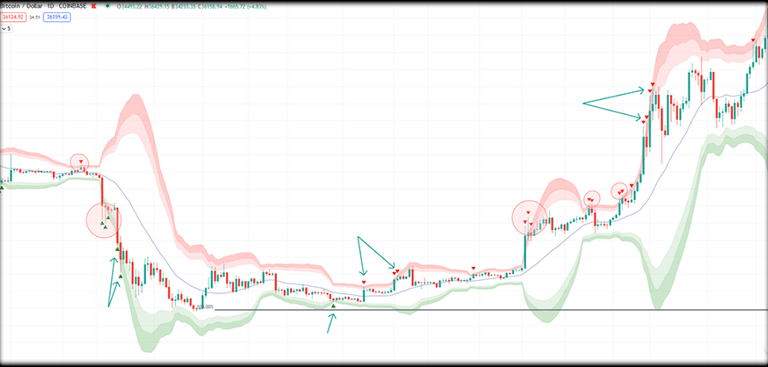
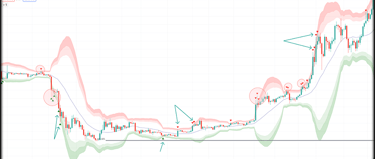
The bands are moving averages and represent a theoretical channel, as can be seen in the picture below, with the price rarely breaking out of them, and being quickly reintegrated between the bands when it does.
The upper bands therefore represent resistance for the price and the lower bands represent support, but this does not mean that the aim is to bet up or down on these levels.
What's important to observe is the width of the bands. When they narrow, it's because the price is consolidating, and the more it consolidates, the thinner the bands become. This is when the likelihood of an explosive move is greatest. The indication of a strong movement ahead does not indicate the direction of that movement.
When the price begins to break through the theoretical range represented by the bands, the trend is set in motion and the bands begin to diverge. The longer the trend continues, the further the bands will spread. Once the trend begins to run out of steam, the bands start to tighten.
The example below highlights the different market phases that can be detected using Bollinger bands:
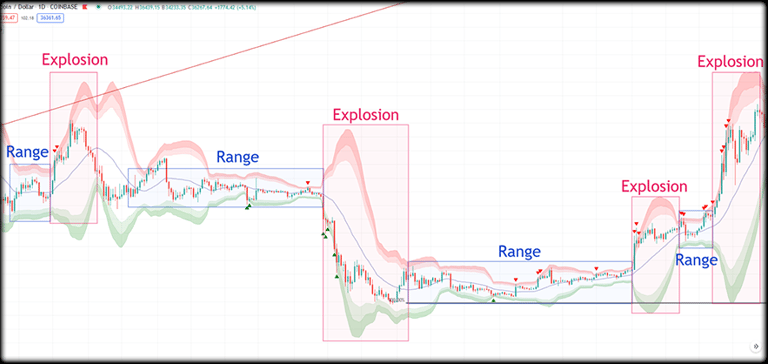
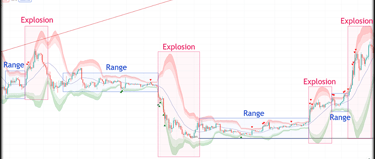
As you can see, this indicator is very precise and intuitive. At a glance, you can define whether we're in trend or accumulation, and know when to get in if it's not time! This indicator works on all time units and fulfils the same role as the Choppiness Index, so you can compare them to see which one suits you best.
©2025
Contact@watchlist360.io
Watchlist360 does not provide any financial advice
⚠️Investing involves risk and may lead to partial or total loss of your capital⚠️